Deploy Grafana on Kubernetes using K3s
Posted by NetworkWhois on
Not too long ago, my infrastructure monitoring was a complete mess. Scattered metrics, no unified view, constant firefighting. Sound familiar? That's when I discovered the power of Grafana and K3s—a combination that changed everything.
Quick Context: I'm a DevOps engineer who's worked with everything from massive enterprise setups to lean startup infrastructure. Trust me, this solution works.What You'll Need (Don't Panic!)
- A K3s cluster (Spoiler: It's way easier than traditional Kubernetes)
kubectlinstalled (if you're new, no worries—I'll walk you through it)- About 30 minutes and a cup of coffee ☕
The Deployment: Step by Step
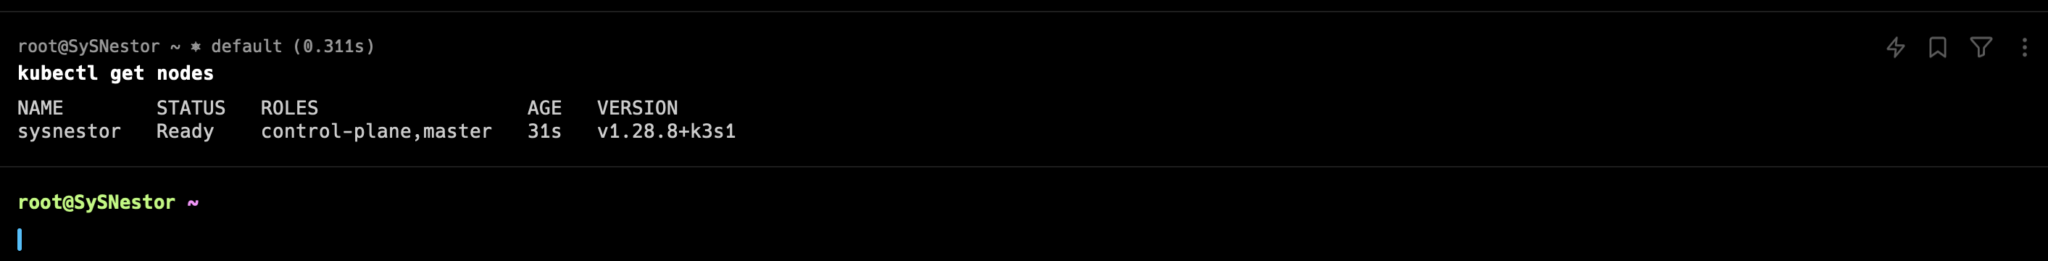
1. Cluster Health Check
kubectl get nodes🟢 Green means go! Make sure your nodes show as "Ready".
2. Helm Installation Magic
curl -fsSL -o get_helm.sh https://raw.githubusercontent.com/helm/helm/master/scripts/get-helm-3
chmod 700 get_helm.sh
./get_helm.sh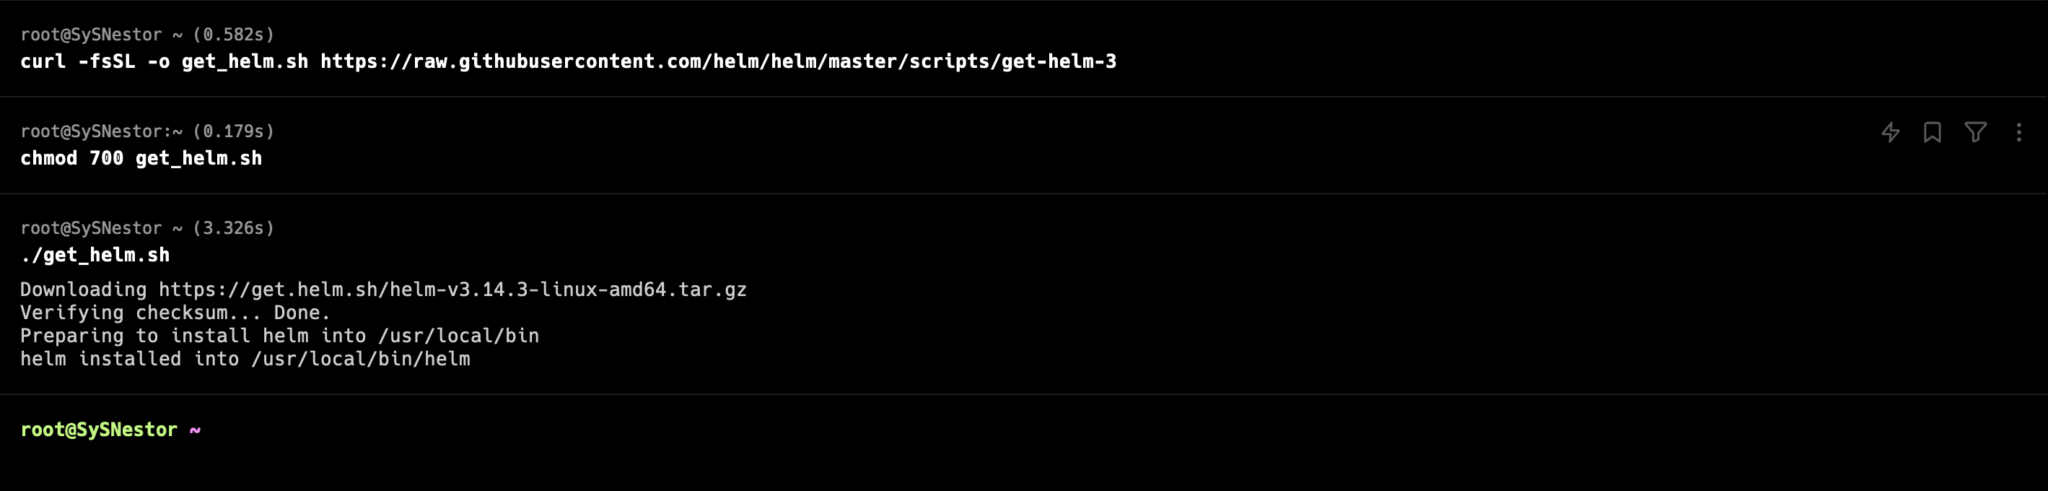
3. Grafana Helm Setup
helm repo add grafana https://grafana.github.io/helm-charts
helm repo update
4. Deploy Grafana (The Moment of Truth!)
helm install my-grafana grafana/grafana \
    --set persistence.storageClassName="local-path" \
    --set adminPassword="YourSecurePassword" \
    --set service.type=LoadBalancer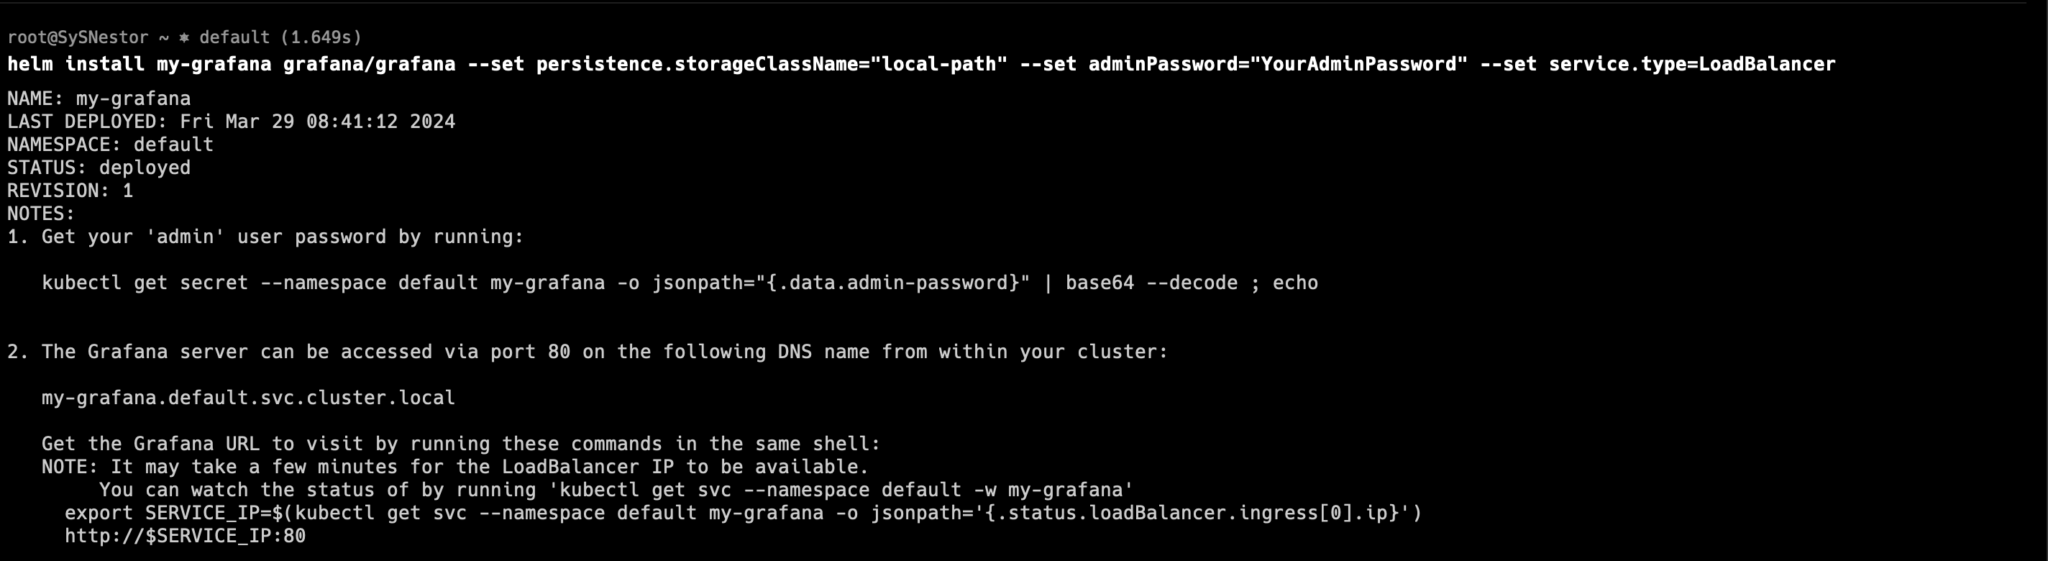
🔒 Pro Security Tip: Use a complex password. No "password123" allowed!
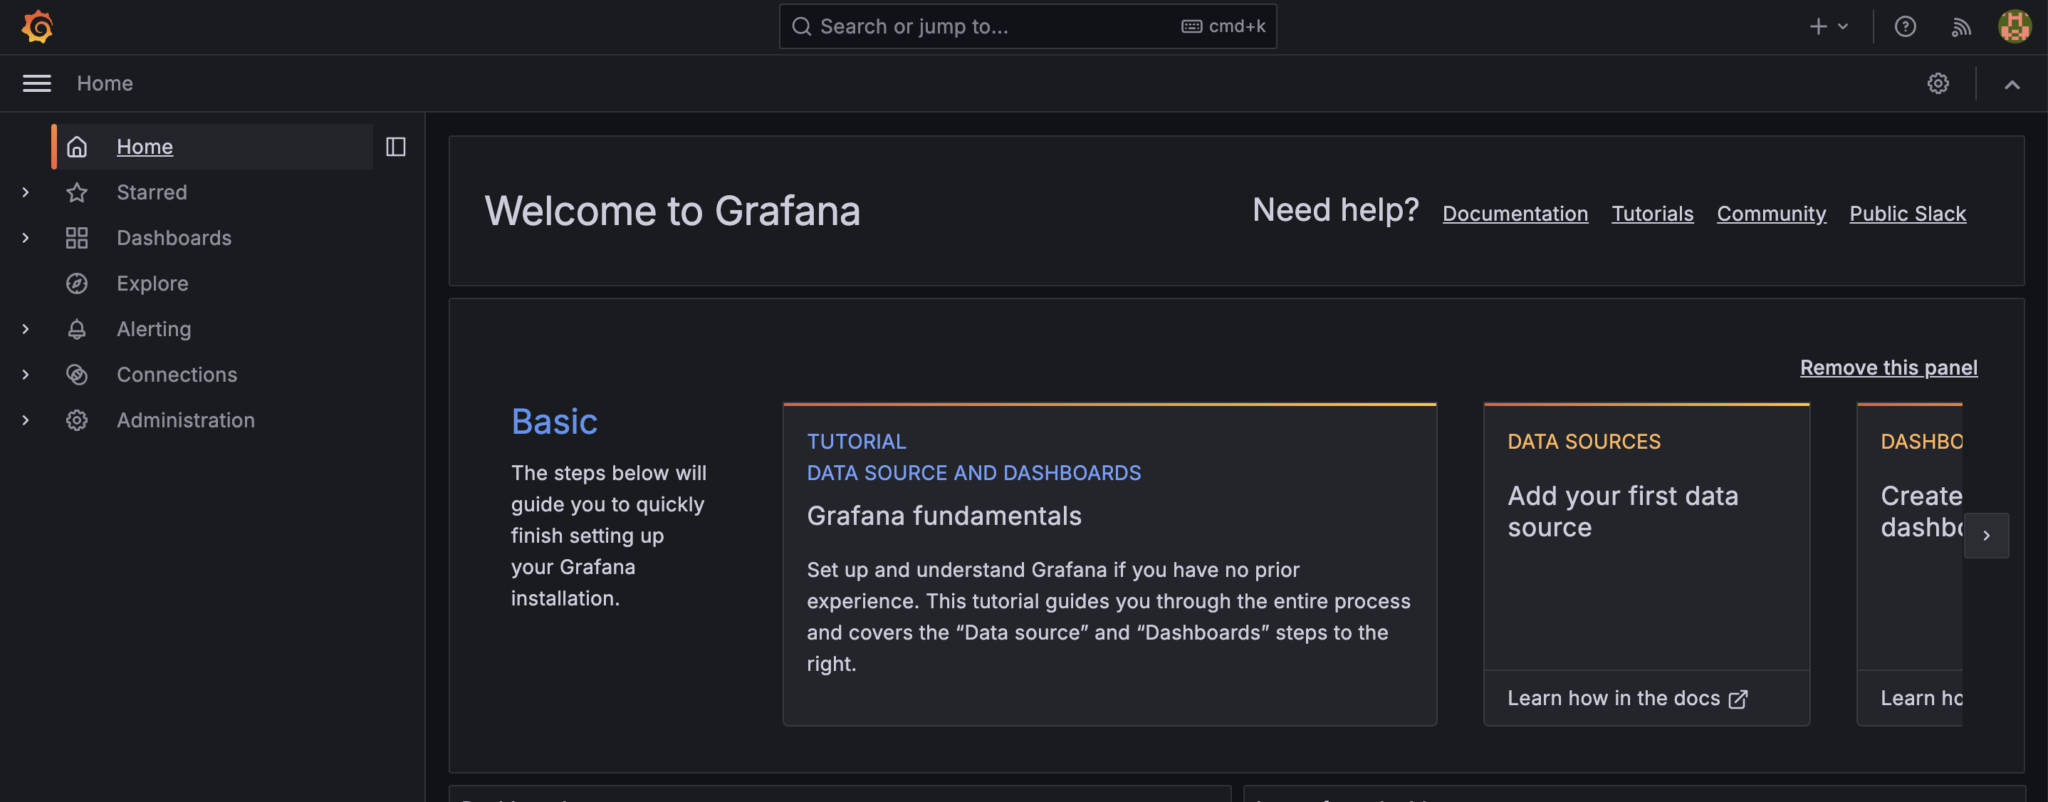
Getting Inside Your New Dashboard
Find your Grafana's external IP:
kubectl get svc -l "app.kubernetes.io/name=grafana"Navigate to http://<EXTERNAL-IP>:31429. Login with 'admin' and your secret password.
Real Talk: Why This Matters
Monitoring isn't just about pretty graphs. It's about understanding your system's heartbeat, catching issues before they become disasters, and sleeping better at night.
Grafana + K3s = Your new superpower. 🚀
👨💻 Written from my home office, fueled by coffee and curiosity