Deploying Prometheus on Kubernetes using K3s

Posted by NetworkWhois on
Hey there, fellow tech enthusiasts! Today, I'm excited to walk you through an incredibly powerful monitoring setup that's transformed how I manage Kubernetes clusters. Whether you're just getting started with monitoring or looking to level up your observability game, this guide is going to be your new best friend.
Let's break down what we're working with. Prometheus is an absolute powerhouse when it comes to open-source monitoring solutions. Think of it as your cluster's personal health tracker—collecting and processing critical metrics like CPU usage, memory consumption, and I/O performance. And when you pair it with Grafana? Magic happens.
K3s is my go-to lightweight Kubernetes distribution. If you're tired of complex, resource-hungry Kubernetes setups, K3s is going to be a breath of fresh air. It simplifies cluster deployment without compromising on functionality—perfect for small to medium-sized environments.
Prerequisites
Before we dive in, make sure you have:
- A running K3s cluster (If you haven't set this up, no worries—we've got tutorials to help you get started)
- Basic understanding of Kubernetes concepts like pods, services, and deployments
- Grafana installed and configured to communicate with your K3s cluster
Step 1: Setting Up the Namespace for Prometheus
Namespaces are like organized folders in your Kubernetes cluster. Creating a dedicated namespace for Prometheus keeps everything clean and prevents potential conflicts.
kubectl create namespace monitoring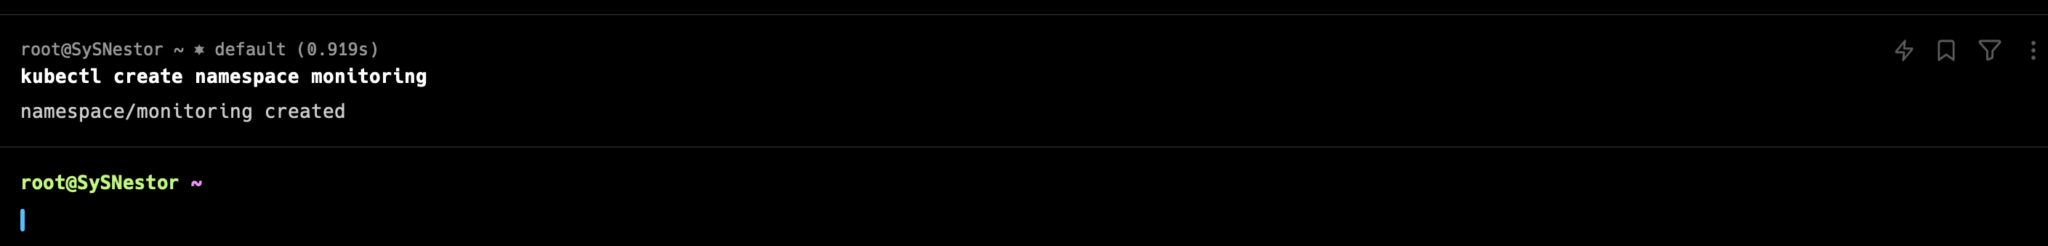
This command creates a monitoring namespace where all our Prometheus resources will live harmoniously.
Step 2: Installing Prometheus using Helm
Helm is essentially the package manager for Kubernetes. It makes complex deployments feel like a walk in the park. Let's get it set up.
First, install Helm (if you haven't already):
curl -fsSL -o get_helm.sh https://raw.githubusercontent.com/helm/helm/master/scripts/get-helm-3
chmod 700 get_helm.sh
./get_helm.sh
Next, add the Prometheus community Helm repository:
helm repo add prometheus-community https://prometheus-community.github.io/helm-charts
helm repo update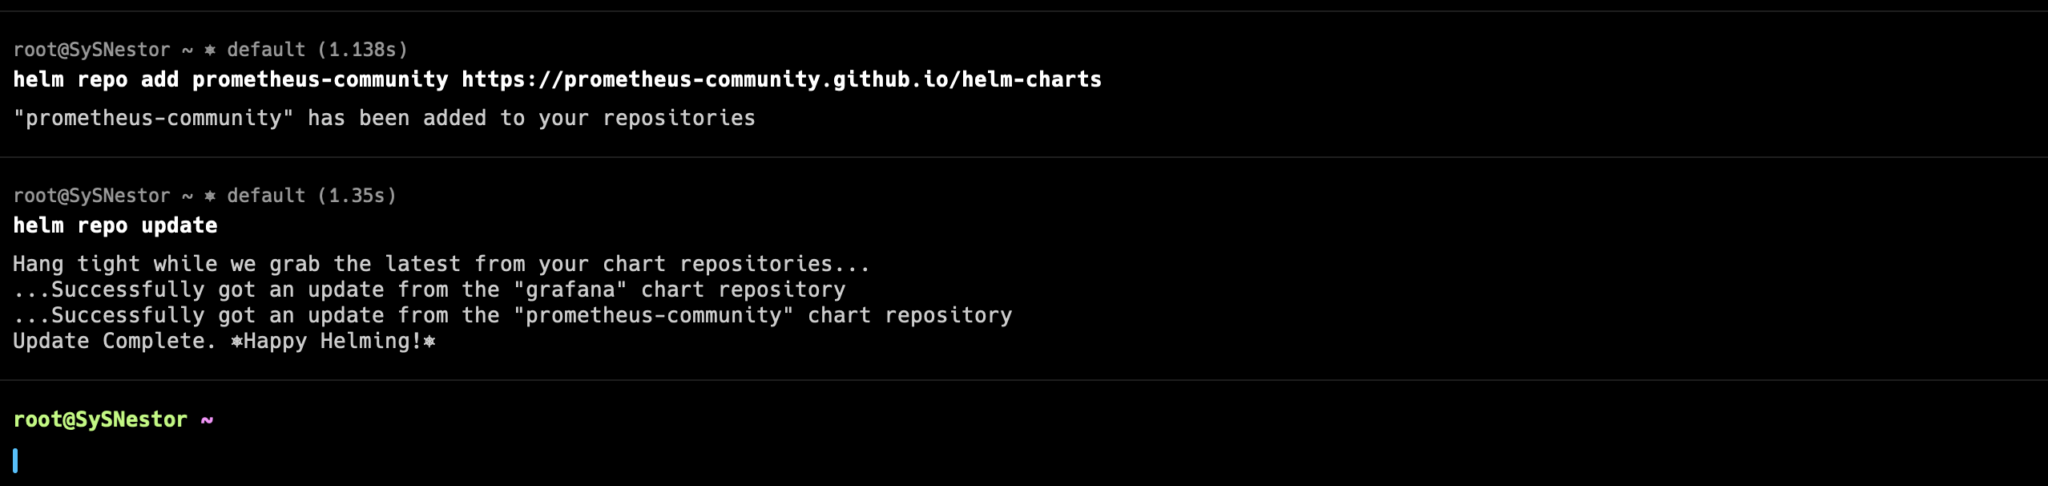
Now, let's install Prometheus in our monitoring namespace:
helm install prometheus prometheus-community/prometheus \
    --namespace monitoring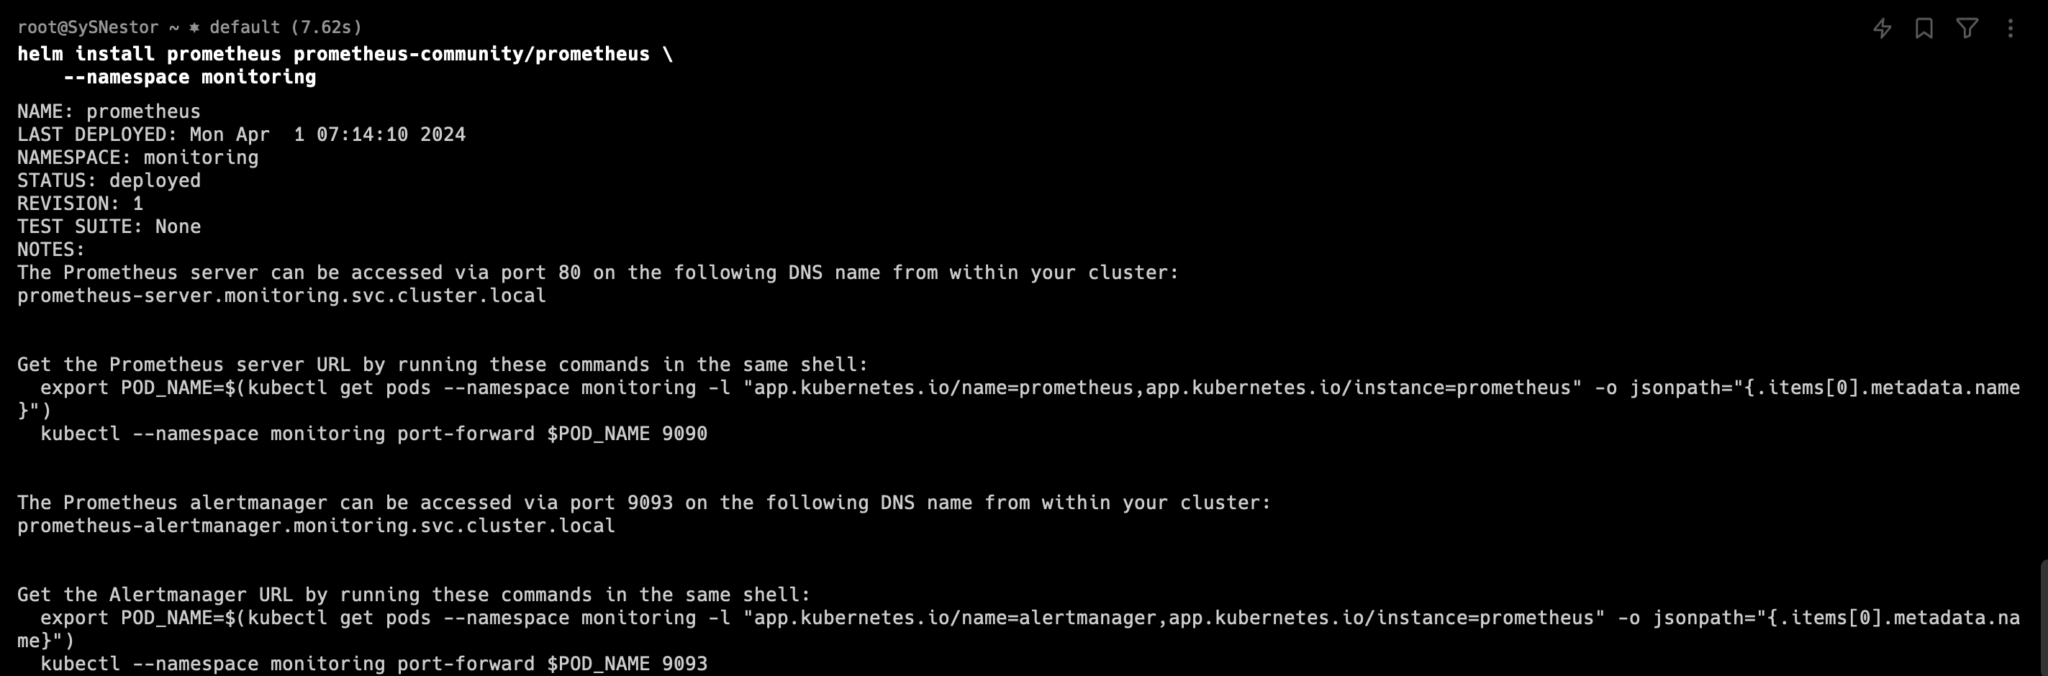
Step 3: Verifying the Installation
Always verify your deployments. Run this command to check your Prometheus pods:
kubectl get pods --namespace monitoring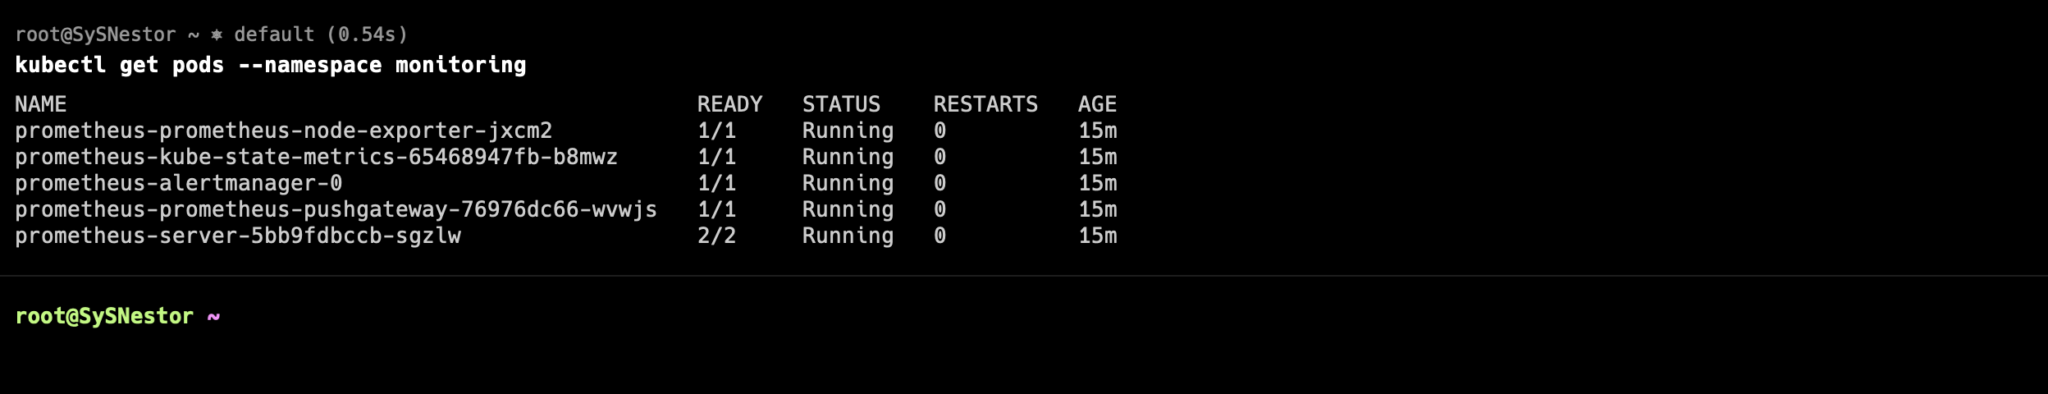
Step 4: Configuring Prometheus as a DataSource in Grafana
Time to make Prometheus and Grafana talk to each other!
- Open Grafana and navigate to "Configuration > Data Sources"
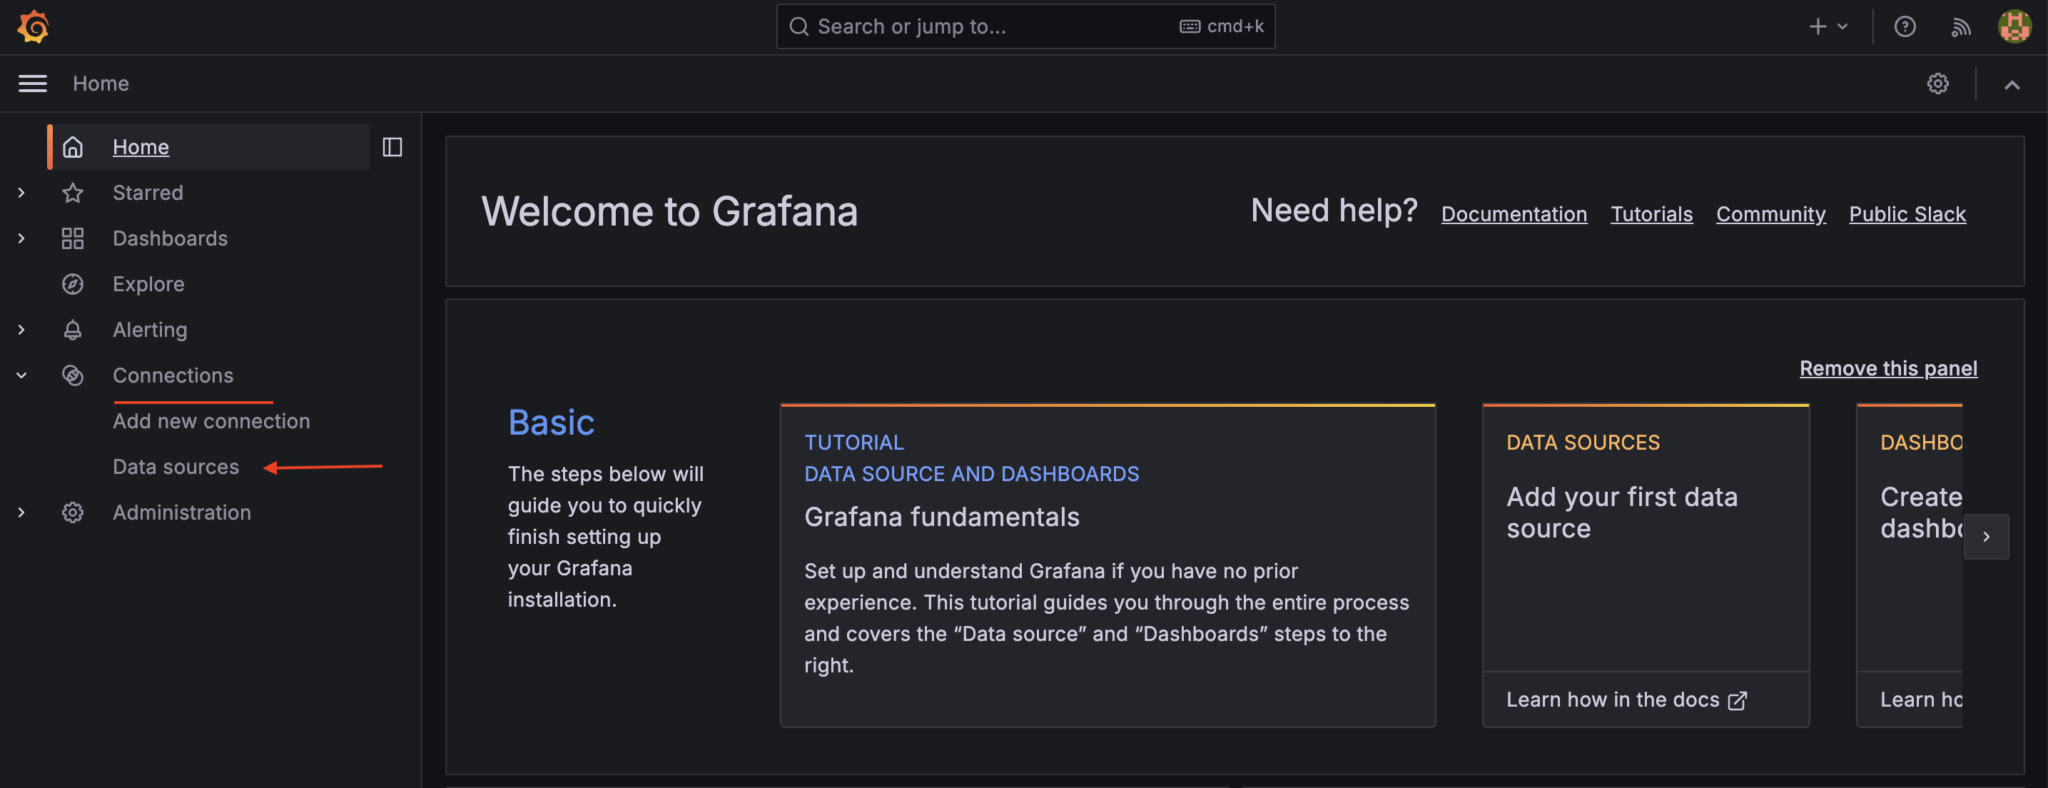
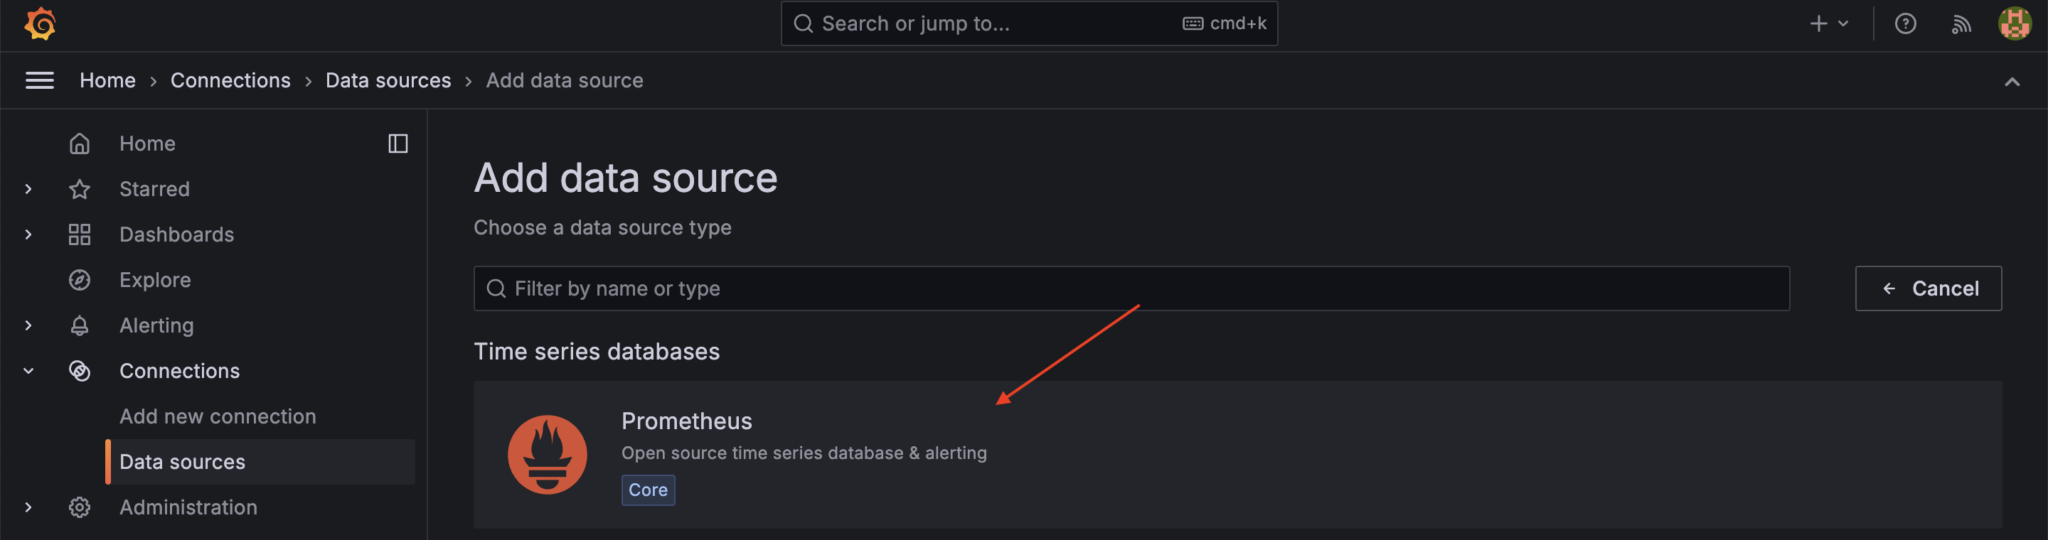
- Click "Add data source," then select "Prometheus"
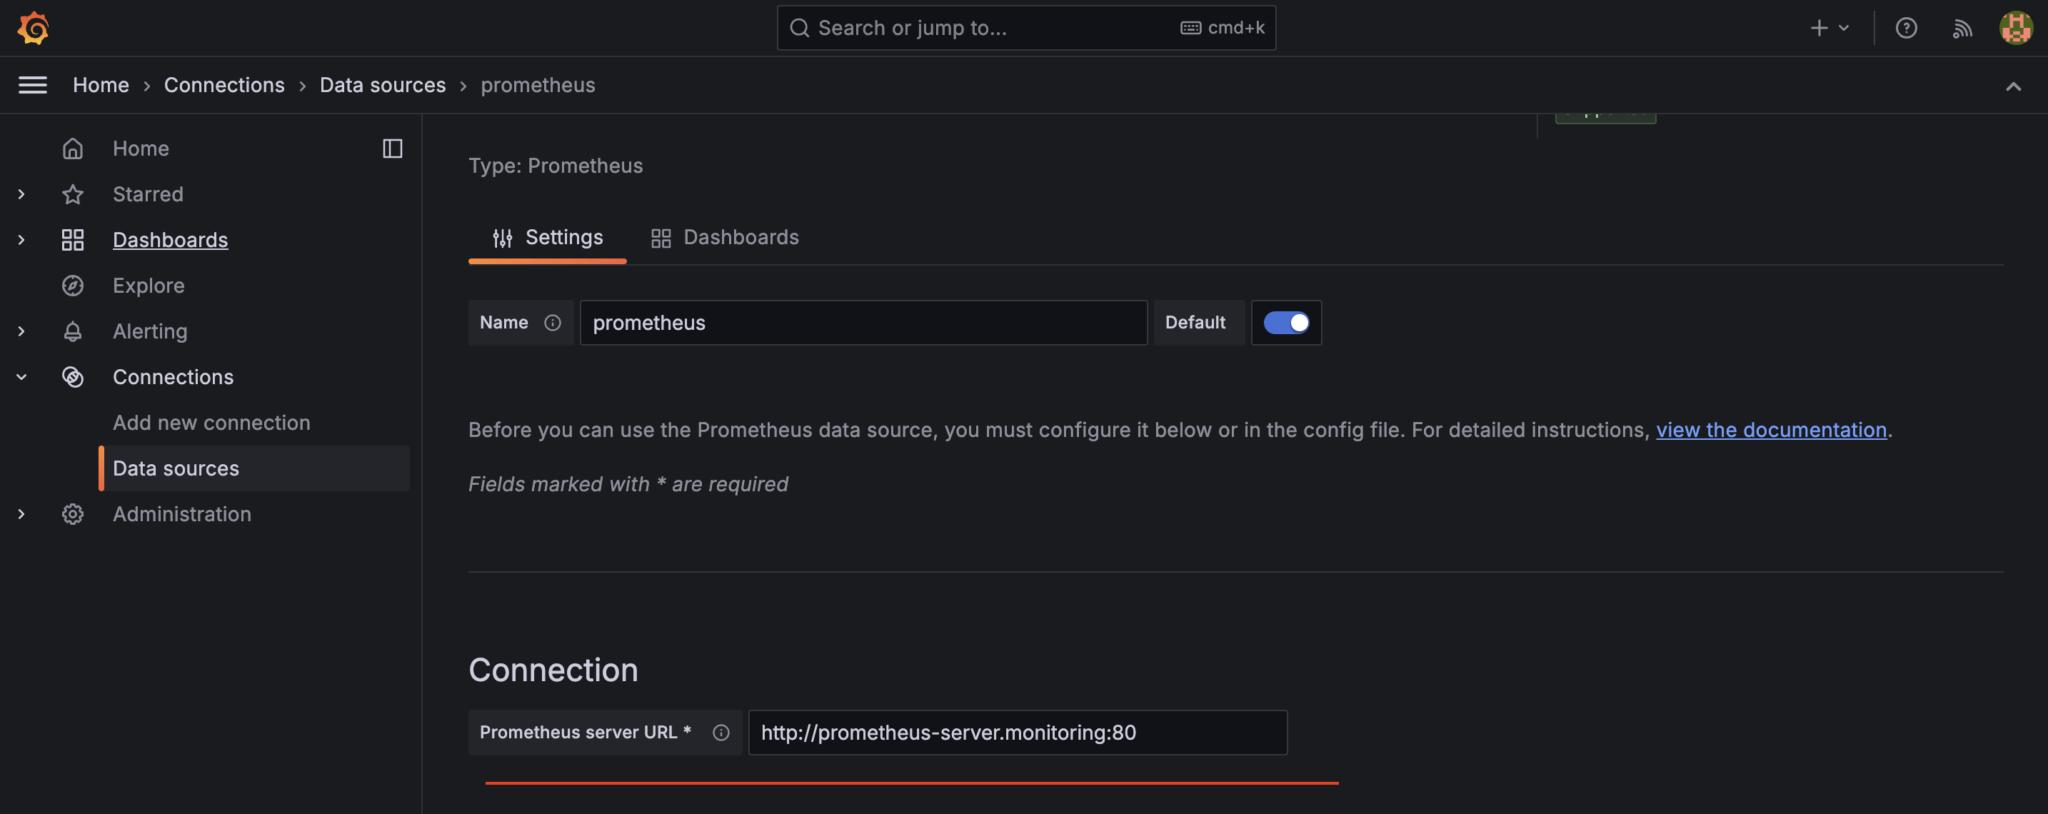
- For the URL, enter:
http://prometheus-server.monitoring:80
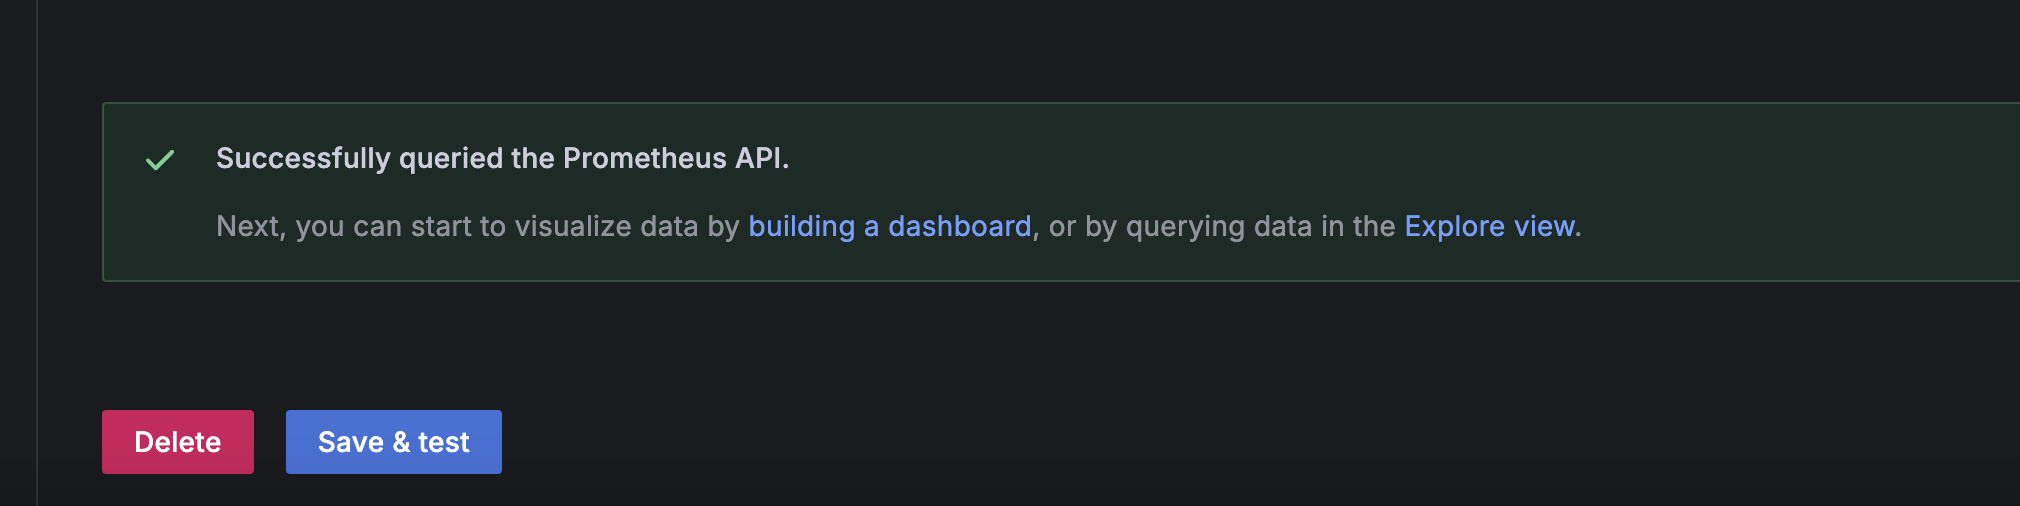
- Save and test the data source
Congratulations! You've just deployed Prometheus on your K3s cluster and integrated it with Grafana. This setup is going to be a game-changer for monitoring your infrastructure.
Monitoring isn't just a nice-to-have, it's important for maintaining the health and performance of your applications. With Prometheus and Grafana, you're now equipped with powerful tools to visualize metrics and gain deep insights into your K3s cluster's operation.
Remember, this is just the beginning. As you get more comfortable, you'll discover even more ways to leverage these incredible monitoring tools.