How I Deploy Grafana Mimir on Kubernetes
Posted by NetworkWhois on
Hey there! Last week, I spent a couple of days getting Grafana Mimir running on my K3s cluster, and boy, what a journey it was. After dealing with a few hiccups and learning some valuable lessons, I thought I'd share my experience to save you some headaches. Why Mimir? Well, I needed something more robust than plain Prometheus for my monitoring setup, and Mimir seemed like the perfect fit with its long-term storage capabilities.
Quick backstory: I work with a bunch of microservices, and our monitoring needs kept growing. Prometheus was great, but we needed something that could scale better and handle our historical data more efficiently. That's when I discovered Mimir, and after some testing, I'm pretty impressed with how it's performing.
Before You Start - The Reality Check
First things first - let me save you some time by listing what you'll need:
- A decent machine with at least 2GB RAM and 2 CPUs (honestly, I'd recommend a bit more if you can spare it - I initially tried with 2GB and it was a bit tight)
- Some Kubernetes knowledge (you don't need to be an expert, but knowing the basics helps)
- K3s installed and running
- kubectl ready to go
Setting Up Helm - Your New Best Friend
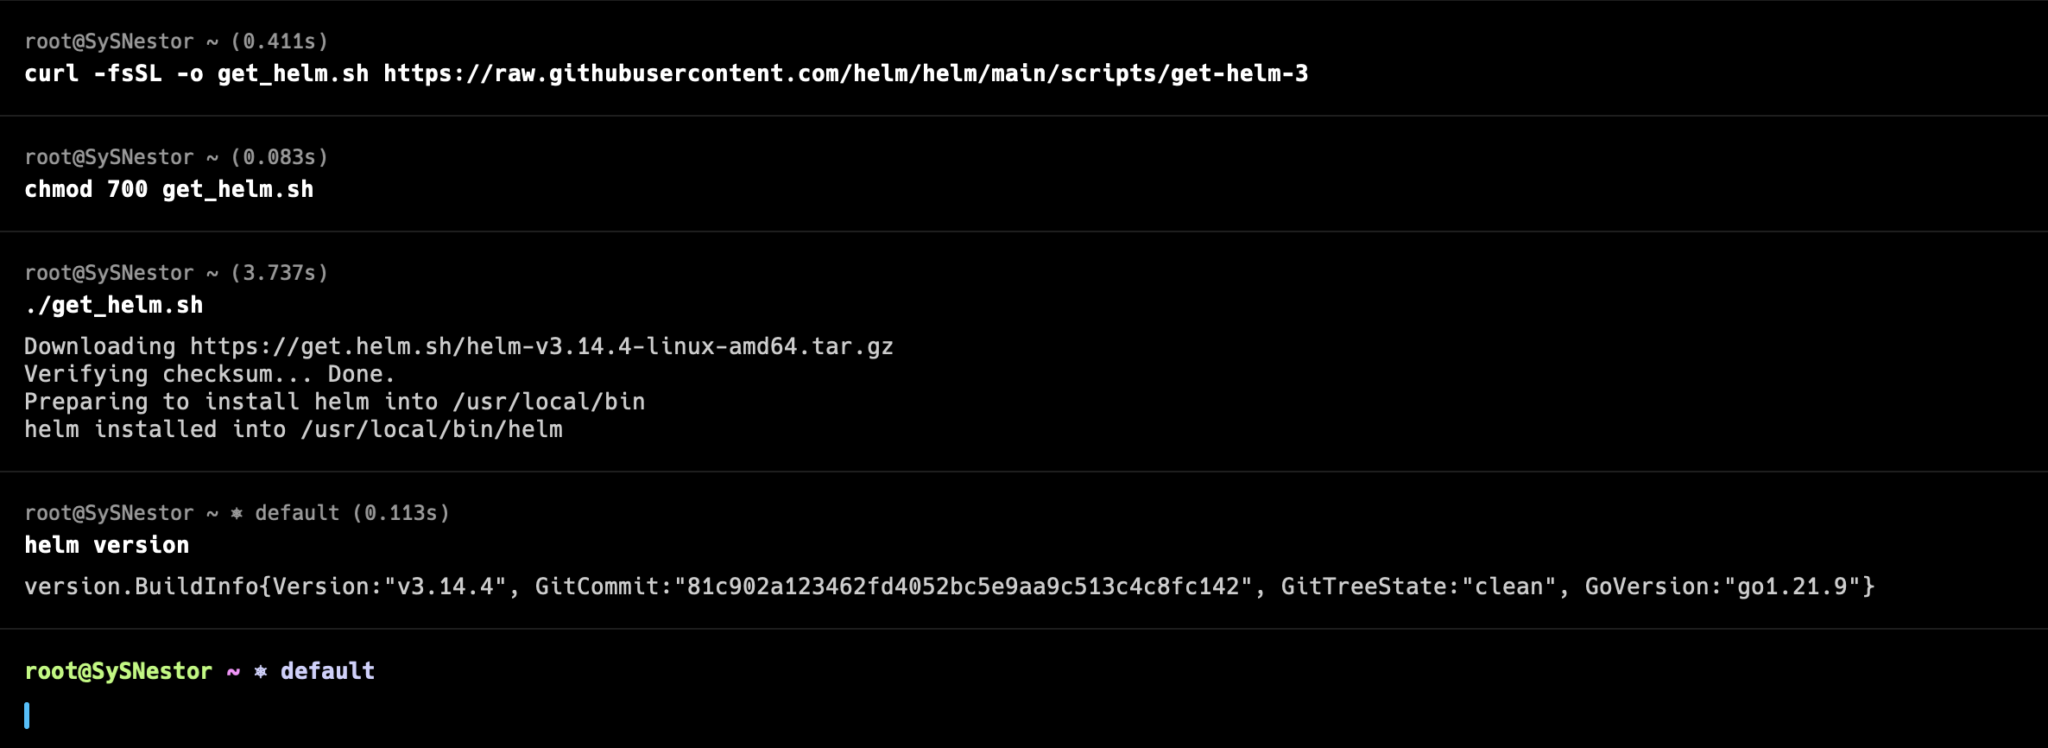
First up is Helm. Trust me, you'll want to use Helm for this - it makes life so much easier. Here's how I got it running:
curl -fsSL -o get_helm.sh https://raw.githubusercontent.com/helm/helm/main/scripts/get-helm-3
chmod 700 get_helm.sh
./get_helm.sh
Make sure it's working with a quick:
helm version
 Heads Up! If you get any permission errors during the Helm installation (like I did), running it with sudo might help. Just be careful with those permissions!
Getting Prometheus Up and Running
Here's where things get interesting. Mimir works alongside Prometheus, so we need to set that up first. I created a dedicated namespace for all our monitoring stuff:
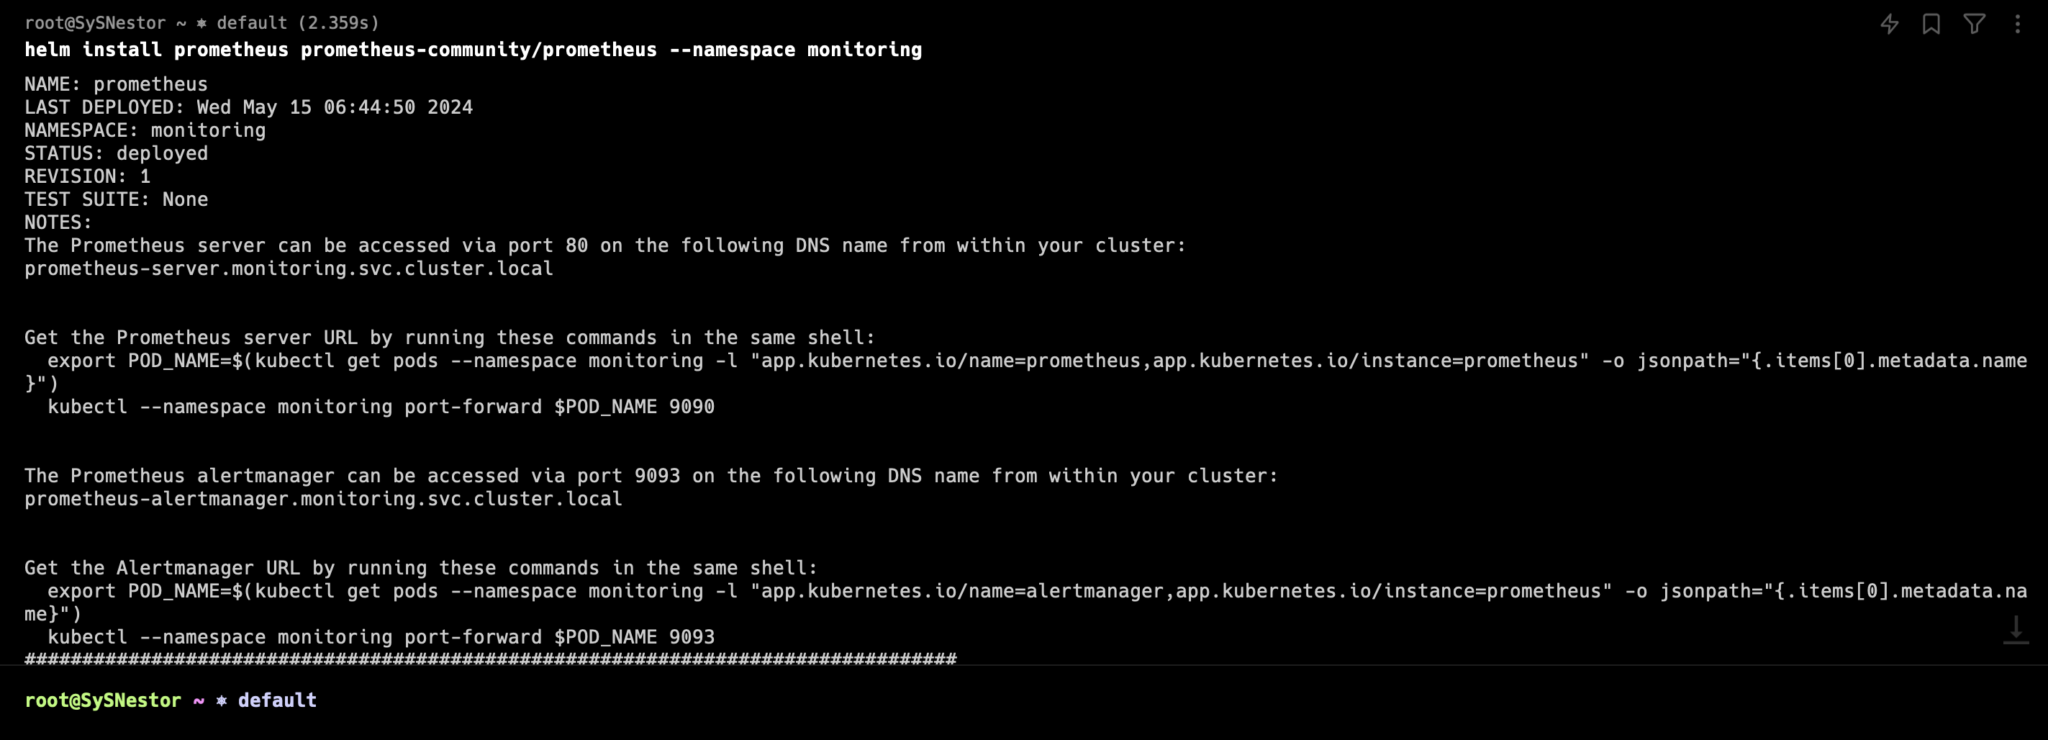
kubectl create namespace monitoring

# Add the repo and install Prometheus
helm repo add prometheus-community https://prometheus-community.github.io/helm-charts
helm repo update
helm install prometheus prometheus-community/prometheus --namespace monitoring
Now, here's something that tripped me up at first - wait for all the pods to be ready before moving on. You can check their status with:
kubectl get pods -n monitoring
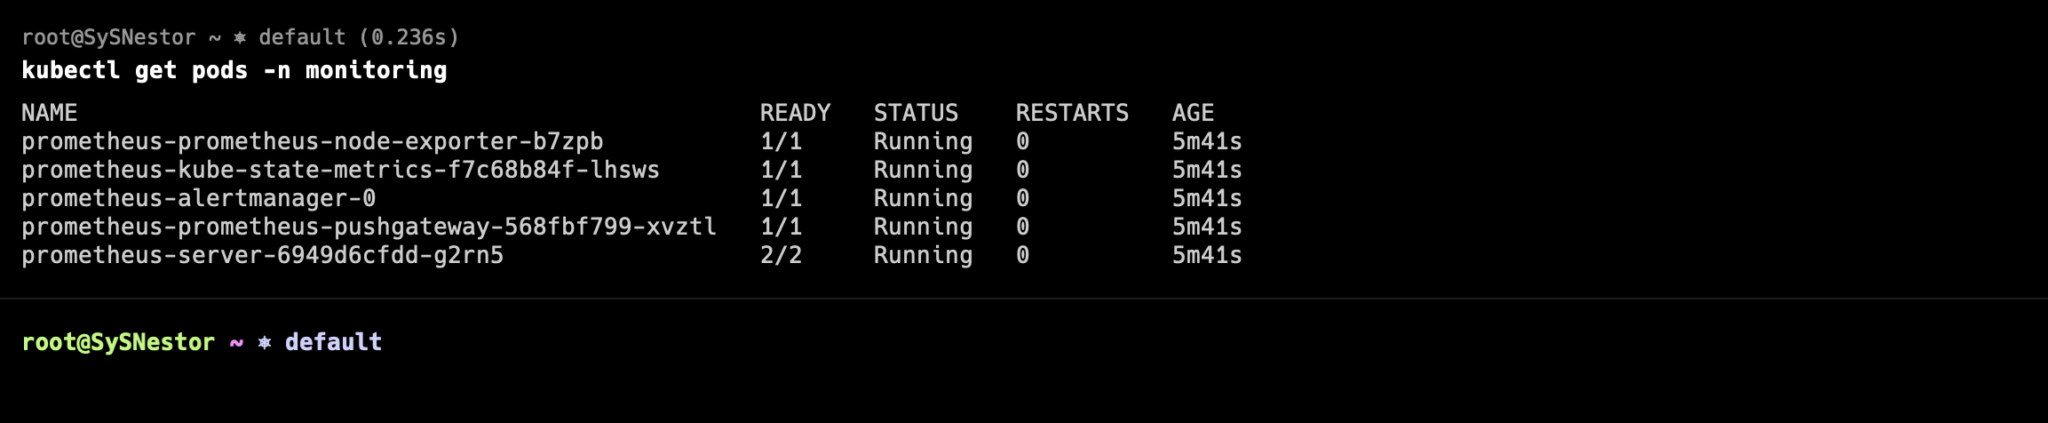
If you see any pods in a pending state, it might be because of resource constraints. Been there, done that - had to upgrade my machine's resources to get everything running smoothly.
The Main Event - Installing Mimir
Alright, now for the part you've been waiting for. Installing Mimir is pretty straightforward:
helm repo add grafana https://grafana.github.io/helm-charts
helm repo update
helm install mimir grafana/mimir-distributed --namespace monitoring
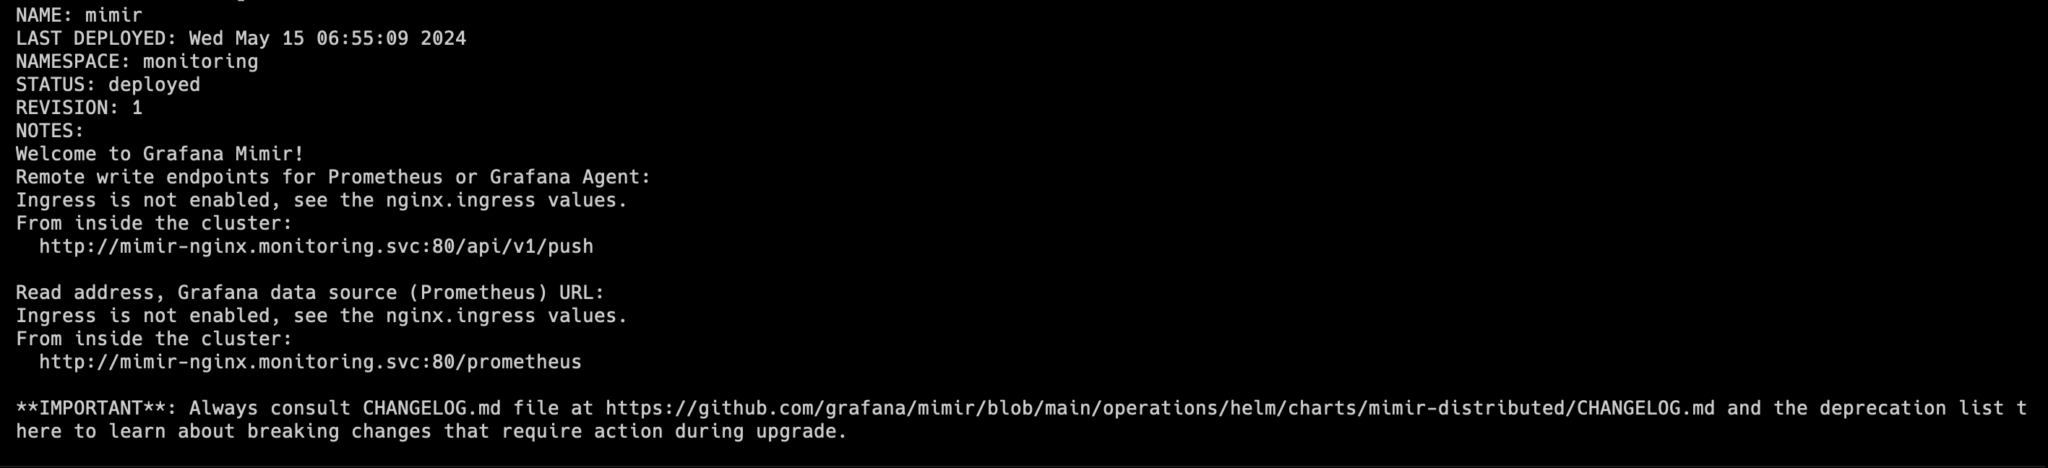
A word of caution from my experience: this might take a few minutes to fully come up. I initially thought something was wrong because some pods were taking their time, but patience is key here.
Configuration - Making It Your Own
Here's a configuration that worked well for me after some tweaking. Create a file called mimir-config.yaml:
apiVersion: v1
kind: ConfigMap
metadata:
  name: mimir-config
  namespace: monitoring
data:
  mimir.yaml: |
    distributor:
      shard_by_all_labels: true
    ingester:
      chunk_retain_period: 1h
    frontend:
      query_range_split_interval: 24h
Apply it with:
kubectl apply -f mimir-config.yaml
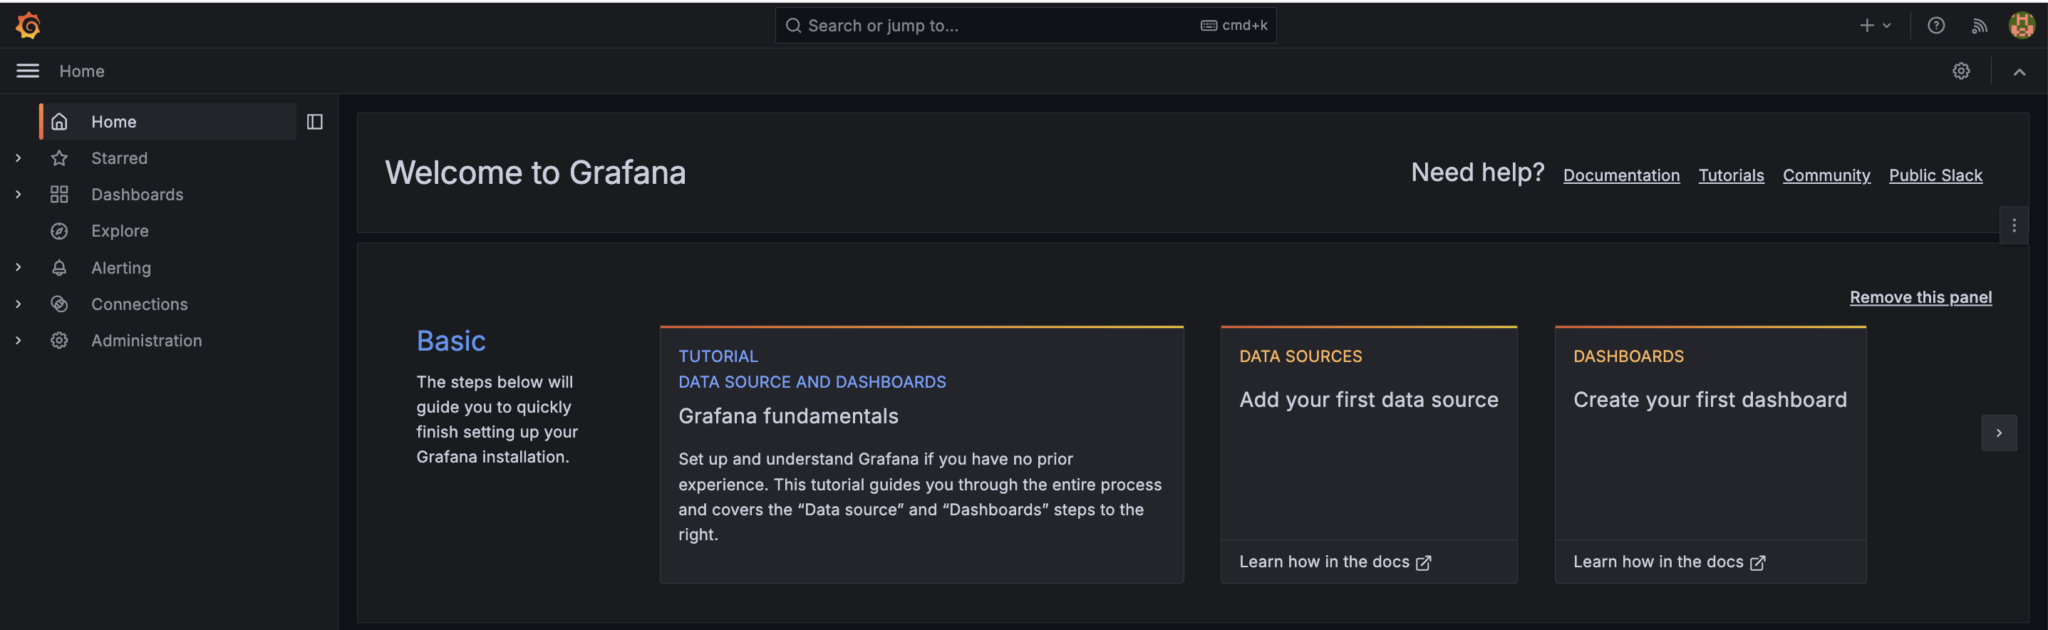
Setting Up Grafana - The Fun Part
Now let's get Grafana running so we can actually see what's going on:
helm install grafana grafana/grafana --namespace monitoring
To access it locally (which is what I usually do during setup):
kubectl port-forward -n monitoring svc/grafana 3000:80
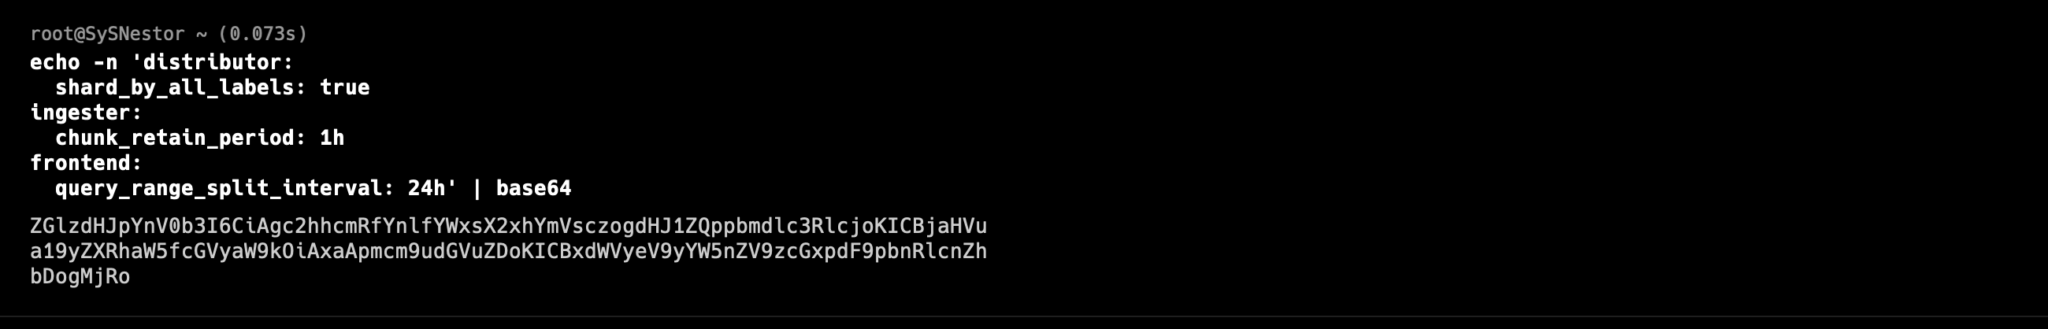
You can now access Grafana at http://localhost:3000. The default login is admin and the password can be found using:
kubectl get secret --namespace monitoring grafana -o jsonpath="{.data.admin-password}" | base64 --decode ; echo
Connecting Everything Together
Once you're in Grafana, you'll need to add Mimir as a data source. Here's what worked for me:
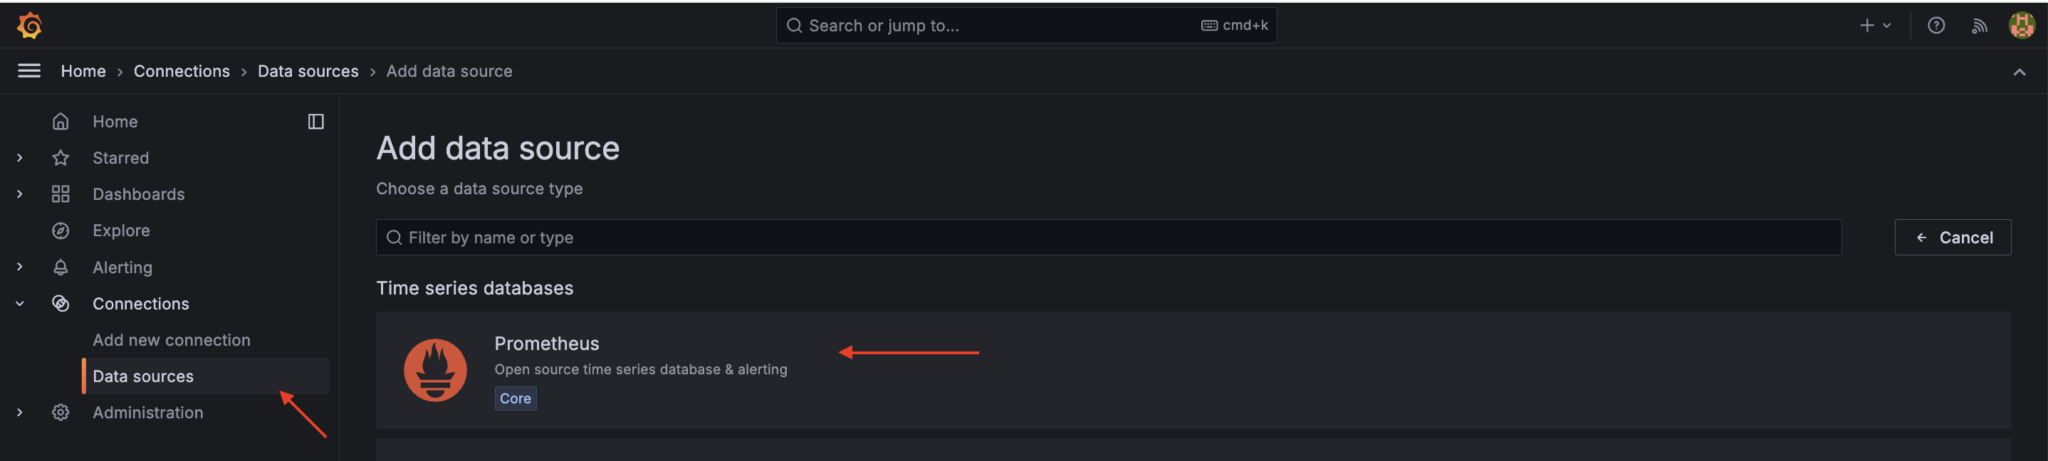
- Go to Configuration > Data Sources
- Click "Add data source"
- Pick Prometheus (yes, Prometheus - Mimir uses the same protocol)
- Set the URL to http://mimir-nginx/prometheus
- Hit "Save & Test"
Production Tips
If you're planning to use this in production (like we do), you might want to expose Grafana properly instead of using port-forward. The quickest way is to change the service type to NodePort:
kubectl edit svc grafana -n monitoring
Find "type: ClusterIP" and change it to "type: NodePort". Though honestly, in production, you might want to set up proper ingress rules - but that's a story for another day.
Wrapping Up
After running this setup for a few months now, I can say it was definitely worth the effort. Our metrics are more reliable, we can store them longer, and the whole system scales much better than our old setup. Sure, it took some trial and error to get everything just right, but that's part of the fun, right?
If you run into any issues or need to tweak things, the Grafana community is super helpful. I've found some great solutions on their Discord channel and GitHub discussions.