How I Deployed Grafana Tempo on Kubernetes using K3s

Posted by NetworkWhois on
Hey there! If you're looking to set up Grafana Tempo on Kubernetes, I recently went through the process myself, and I’m here to share how easy it was. Grafana Tempo is an awesome distributed tracing system that helps you monitor and debug your microservices. I used K3s (a lightweight Kubernetes distribution) and Helm to make the installation super smooth. Let me walk you through what I did!
What You’ll Need Before Starting
Before jumping into the installation, make sure you have these things ready:
1. A Kubernetes Cluster
You’ll need a Kubernetes cluster up and running. If you don’t have one, I highly recommend using K3s. It’s lightweight, easy to set up, and perfect for smaller environments. I followed this guide to install K3s on Ubuntu, and it worked like a charm.
2. Helm Installed
Helm is a must-have tool for managing Kubernetes applications. Installing it is straightforward. Just run these commands:
# Download Helm binary
curl -fsSL -o get_helm.sh https://raw.githubusercontent.com/helm/helm/master/scripts/get-helm-3

# Install Helm
chmod +x get_helm.sh
./get_helm.sh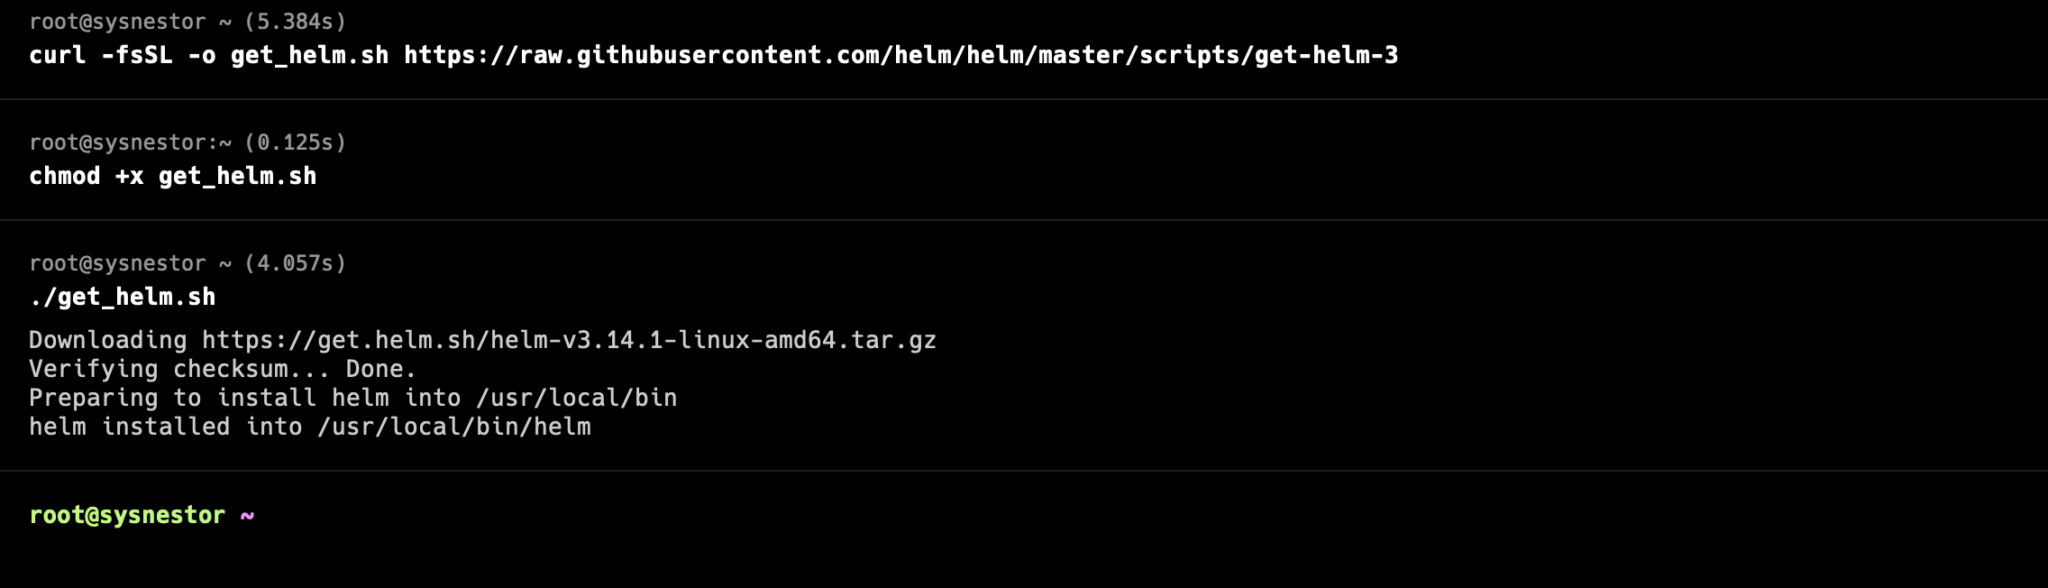
To confirm Helm is installed, run:
helm versionWhat is Grafana Tempo?
Grafana Tempo is an open-source distributed tracing system designed for cloud-native applications. It helps you track requests as they move through your microservices, making it easier to identify performance bottlenecks. The best part? It integrates seamlessly with Grafana, so you can visualize your traces without any hassle.
Why I Chose Grafana Tempo
I picked Grafana Tempo because it’s lightweight, scalable, and works with a variety of tracing protocols. Plus, it’s super easy to set up with Helm, which saves a ton of time.
How I Deployed Grafana Tempo on Kubernetes
Step 1: Installing Grafana Tempo via Helm
Deploying Grafana Tempo using Helm is a breeze. Here’s what I did:
# Add Grafana Helm repository
helm repo add grafana https://grafana.github.io/helm-charts

# Update Helm repositories
helm repo update

# Install Grafana Tempo from OCI registry
helm install gtempo oci://registry-1.docker.io/bitnamicharts/grafana-tempo
This installs Grafana Tempo with default settings. If you need custom configurations, you can tweak the Helm values file.
Step 2: Setting Up Grafana for Visualization
To visualize the traces, I installed Grafana using Helm:
helm install grafana grafana/grafana --set persistence.enabled=true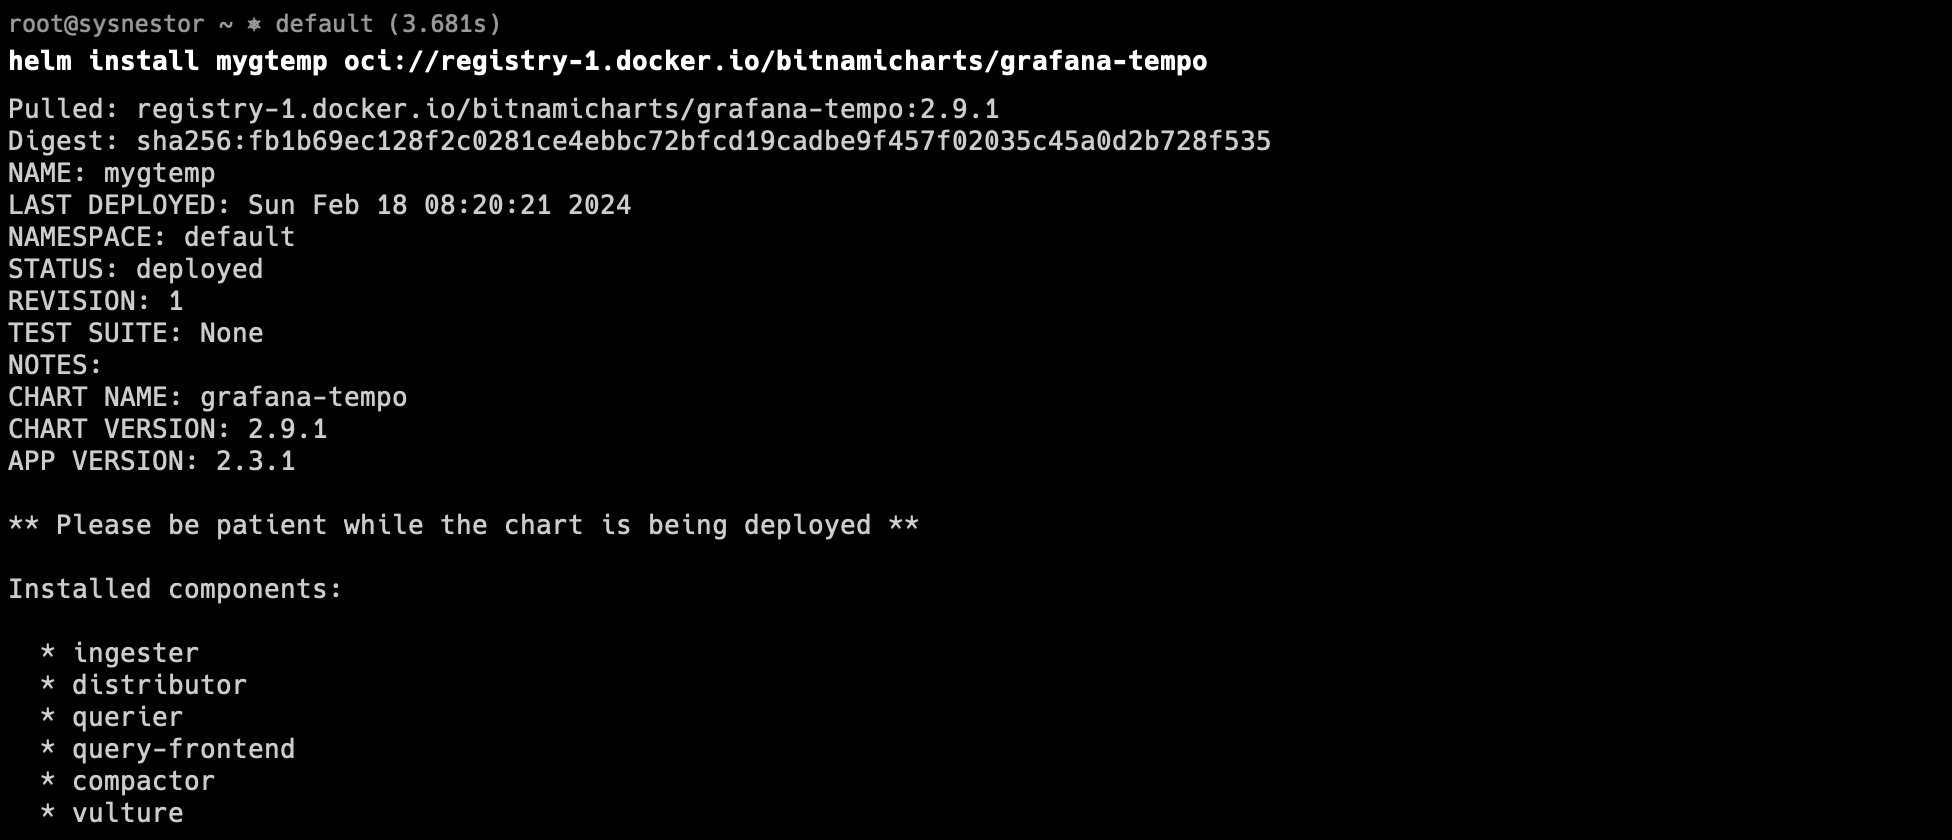
Step 3: Accessing Grafana
To log in to Grafana, I retrieved the admin password using this command:
kubectl get secret --namespace default grafana -o jsonpath="{.data.admin-password}" | base64 --decode ; echo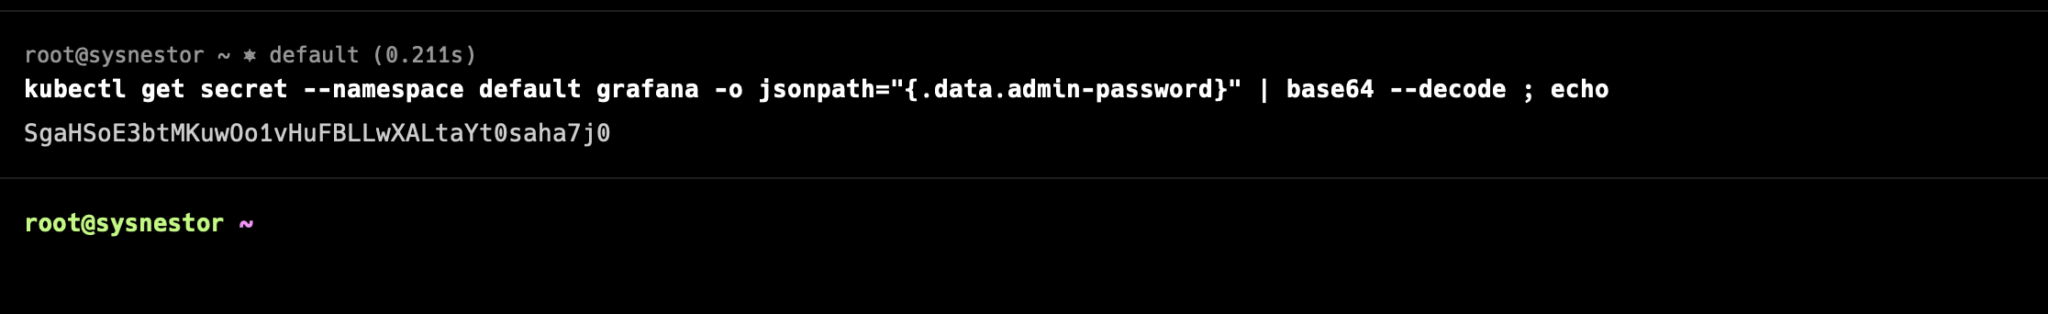
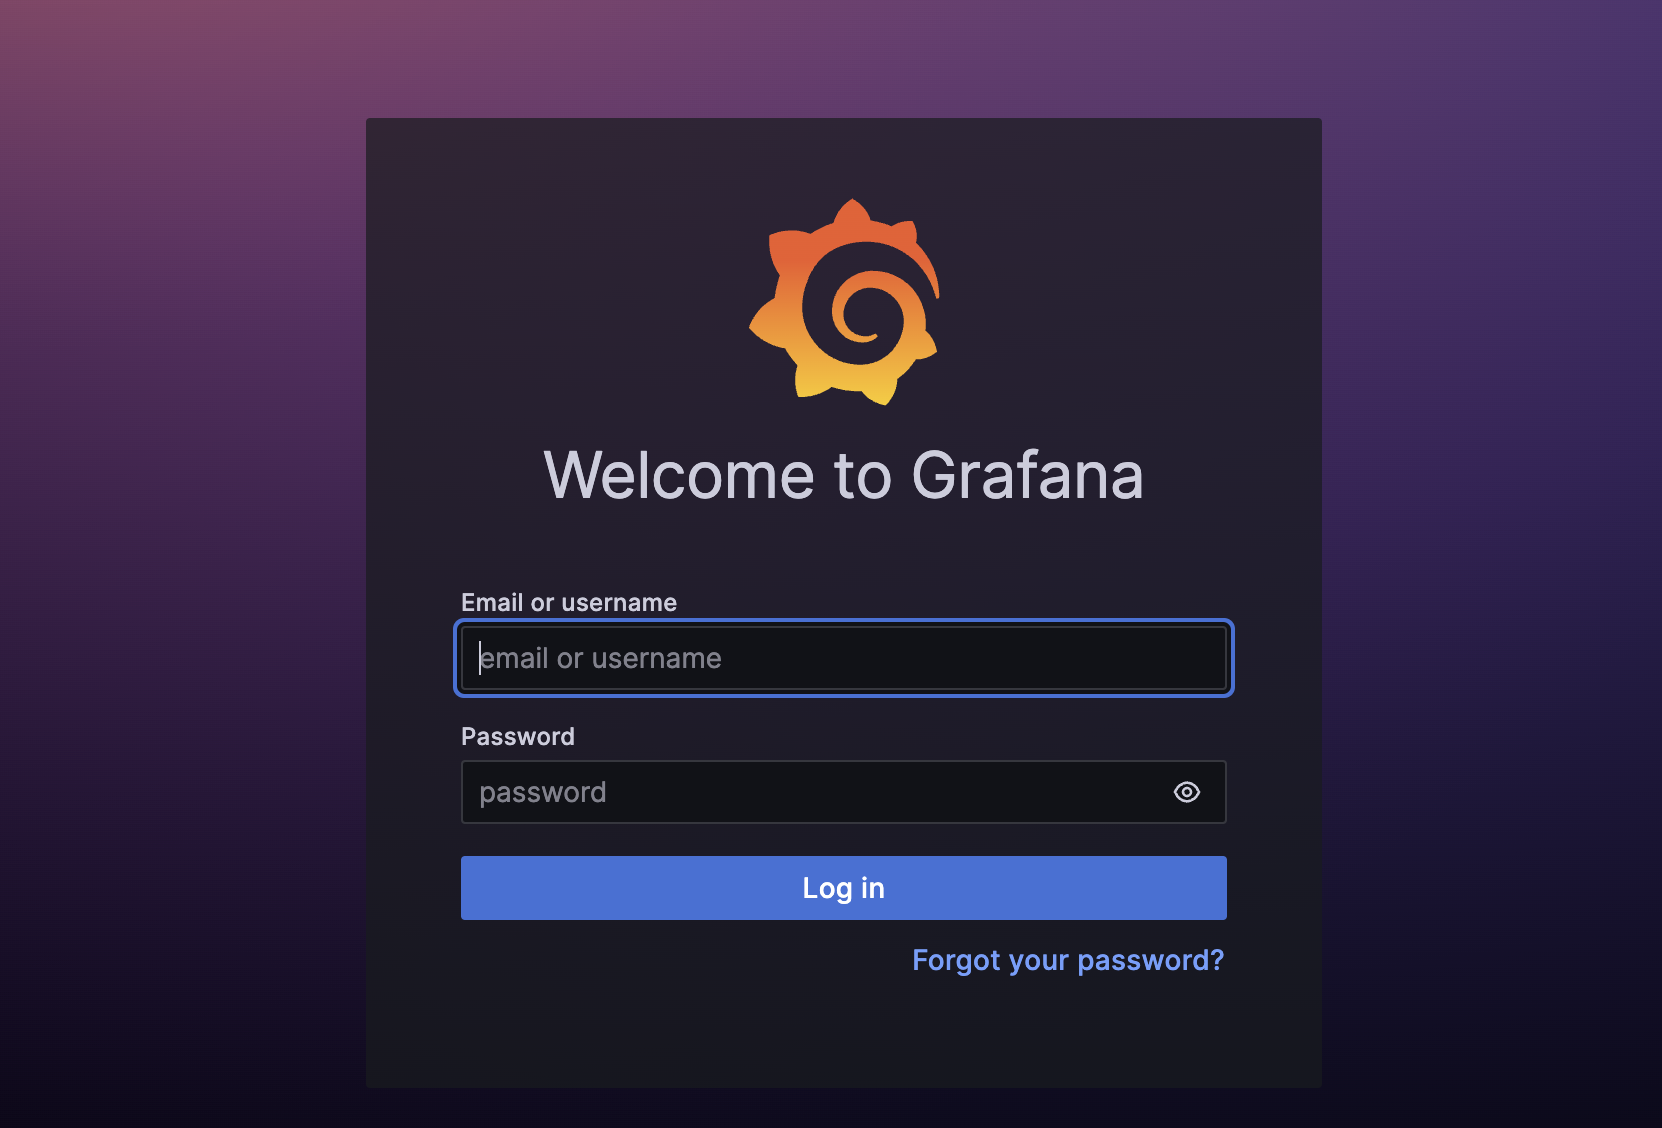
Then, I used port-forwarding to access Grafana in my browser:
export POD_NAME=$(kubectl get pods --namespace default -l "app.kubernetes.io/name=grafana,app.kubernetes.io/instance=grafana" -o jsonpath="{.items[0].metadata.name}")
kubectl --namespace default port-forward $POD_NAME 3000
I opened my browser and went to http://localhost:3000, logged in with the admin credentials, and voilà!
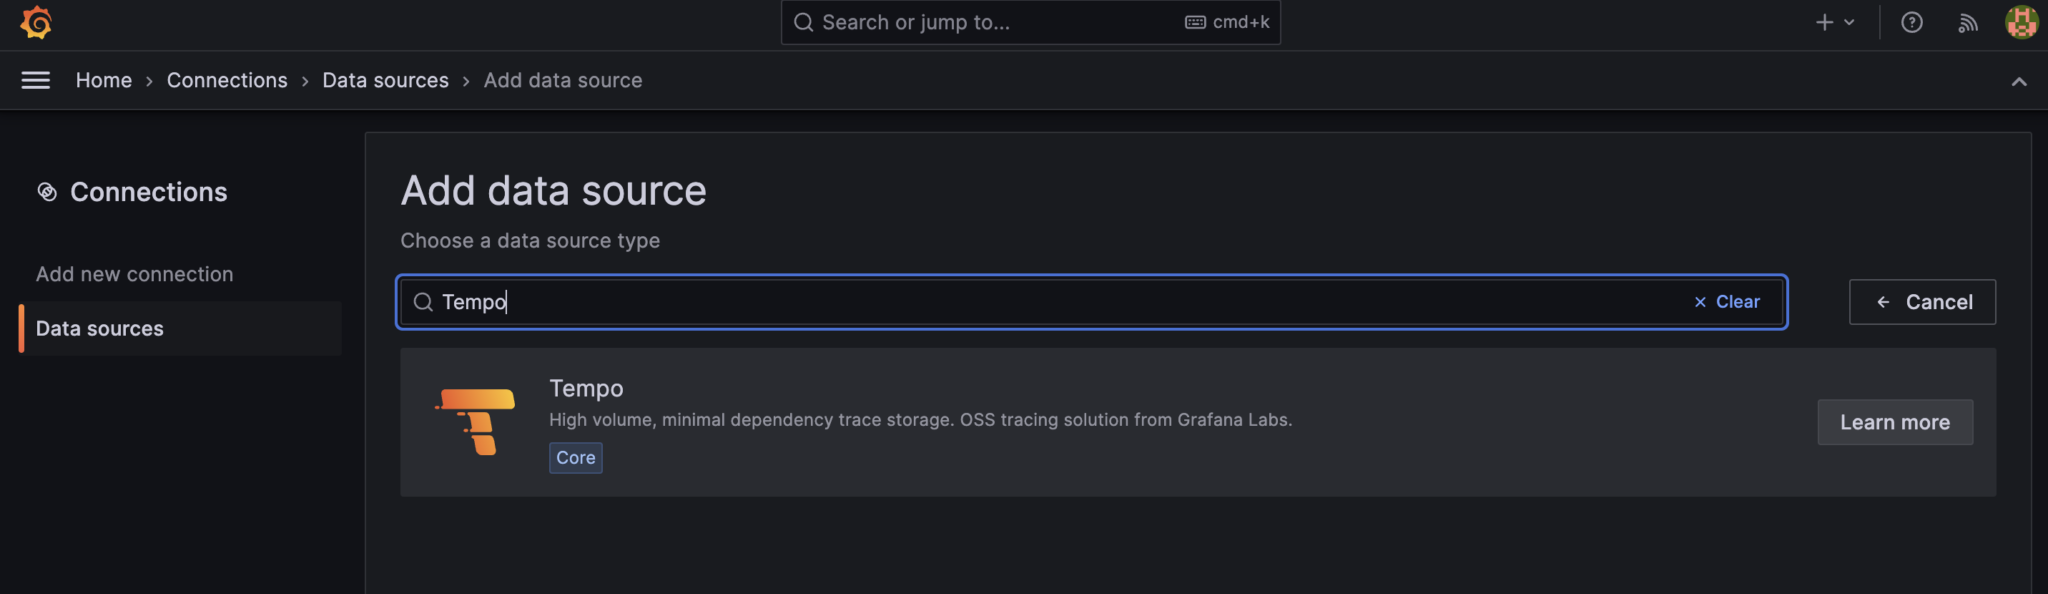
Step 4: Adding Tempo as a Data Source
Once inside Grafana, I added Tempo as a data source:
- Clicked on "Data Sources" in the menu.
- Selected "Add your first data source."
- Searched for "Tempo" and chose "Tempo Datasource."
- Configured the settings:
- HTTP URL: Set to my Tempo instance URL (e.g.,
http://mygtemp-grafana-tempo-query-frontend-headless:3200). - HTTP Access: Selected "direct."
- Timeout: Set to
10s.
- HTTP URL: Set to my Tempo instance URL (e.g.,
- Clicked "Save & Test" to confirm the connection.
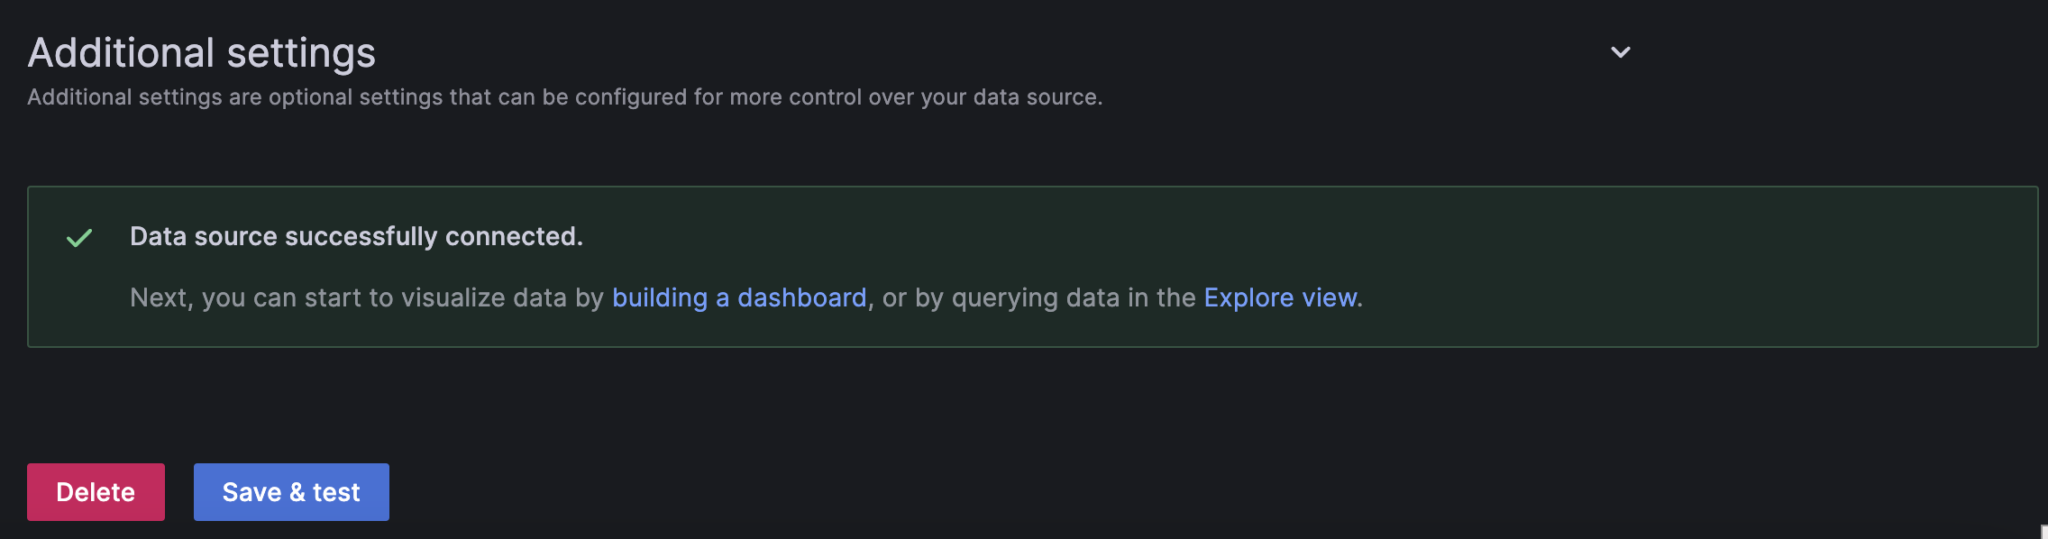
And that’s it! I was able to start visualizing traces in Grafana. The whole process was surprisingly simple, and I’m really happy with how it turned out.